For many, the sheer task of extracting the data from their various systems and then presenting it in a way that others can view, interpret and analyse, is a full-time task.
So, the reality is that many schools are only examining a microscopic amount of their data, for example, NAPLAN results, achievement data, and/or Year 12 ATAR results, to name a few.

They are viewing much of their data in isolation, in other words, only examining achievement data without considering student progress over time.
If we consider that a schools’ key purpose is to support student learning and wellbeing and then it is critical that they gather evidence of student progress and use this to evaluate their impact. Professor Hattie (2012) notes that a teachers’ role is to evaluate the effect they have on students and then to “act on this knowing and understanding…”.
Across all states and education systems (government and independent) schools have to undertake some form of review or re-registration process every 4–5 years. As part of this process, schools must demonstrate compliance with a range of requirements and tracking student achievement and progress sits at the heart of these processes. The AITSL standards also identify at teacher and leadership level standards that require leaders and teachers to “analyse and share information, to monitor progress against goals…” and “a plan how it should be used in the support of student learning outcomes…”.
What does all this mean?
Schools need tools that make it easy for them to expose trends in their data, identify potential issues, whilst at the same time making informed and data-driven decisions about student learning and progress.
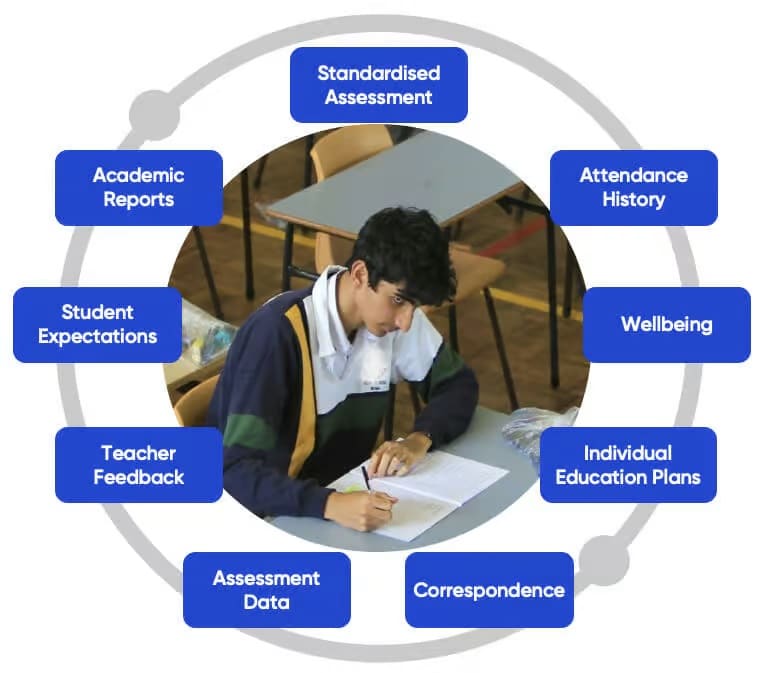
Consider the data that sits within a School’s SEQTA system on an individual student, let’s look at Sam. Sam’s school would have data recorded across all his K–12 years at the school. This data includes his full attendance history, including the number of times he has arrived late to class, all the wellbeing notes entered by teachers, leaders, counsellors etc, individual education plans, correspondence, assessment data both formative and summative, teacher feedback comments, Sam’s student expectations and reflections, all his academic reports and standardised assessment information. This one student has generated a lake of data. Now extrapolate that to a class of students, a year level and a sub-school and the size of the task facing schools is enormous.
How can they access this data and, put it in a form that makes it easy to interpret and analyse and identify the patterns and translate this into classroom practice and improve student learning outcomes?
The SEQTA Analyse tool removes the need for schools to have an understanding of data analytics as there are a wide range of reports and dashboards available, that are immediately useable and can be customised to suit a schools’ requirements. Schools can then start asking the big questions, for example:
- What is the impact of teaching and learning?
- How are individual students progressing across all data sets?
- To what extent are there patterns and trends in our data?
- Which students are making low progress as compared to high achievement in our standardised testing data?
- How are we supporting students on individual education plans?
SEQTA Analyse takes the pain out of data analytics as it enables schools to easily monitor their data oceans using lifeboats. These lifeboats provide live dashboards and reports that facilitate meaningful evidence-based discussions with students, teachers and parents about student progress.